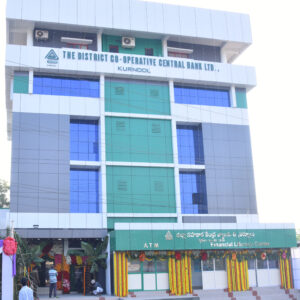
The District Co-operative Central Bank Ltd., Kurnool has established on 08.02.1919 and started its functioning. It is having jurisdiction of 894 villages, 54 Mandals in 99 Primary Agricultural Co-operative Credit Societies & 1 RFCS, 1 JFCS, 1FSCS with network of 23 Branches. It is providing loans for Agriculture Crop Loans, Investment Credit such as Dairy, Sheep, Minor Irrigation, Tractors, Poultry, Horticulture etc., to the farmers through PACS and directly from Branches in addition to it the Bank is providing different loaning products to farmer members through PACS and Directly from Bank Branches under ST Others i.e.. Rythu Nestham, Karshaka Jyothi etc.,

Kurnool Dccb

Smt. N. Mourya
(On 28.06.2024 Hon’ble Collector Smt.
N. Mourya, Joint Collector, Kurnool was assumed Charge as Official PIC of Kurnool DCCB)
KEY PARAMETERS – COMPARATIVE POSITION AT A GLANCE :
(Rs. in lakhs)
| Sl.No | Particulars | 31.03.2013 | 31.03.2014 | 31.03.2015 | 31.03.2016 | 31.03.2017 | 31.03.2018 | 31.03.2019 | 31.03.2020 |
| 1 | Share Capital | 4515.99 | 5292.04 | 5661.97 | 7550.79 | 9144.22 | 11382.15 | 12935.30 | 14183.25 |
| 2 | Reserves | 2177.16 | 2184.20 | 2236.81 | 2352.25 | 2498.17 | 2635.47 | 2710.89 | 2735.38 |
| 3 | Deposits | 17109.25 | 22105.83 | 26538.89 | 36920.05 | 47706.63 | 50030.50 | 53342.02 | 60493.41 |
| 4 | Borrowings | 22356.91 | 29887.31 | 32063.18 | 45511.50 | 61101.99 | 75523.50 | 87876.82 | 92883.27 |
| 5 | Investments | 7389.21 | 7415.90 | 14875.77 | 15521.40 | 17146.24 | 13868.46 | 15617.83 | 15946.29 |
| 6 | Loans & Advances | 32809.98 | 44522.41 | 44547.87 | 67276.43 | 86219.89 | 104406.08 | 118280.87 | 128614.91 |
| 7 | Recovery | 87.00% | 57.68% | 86.02% | 90.08% | 87.00% | 85.19%(Ongoing) | 73.29% | 79.84% |
| 8 | Profit | (+)60.04 | (+)229.54 | (+)375.17 | (+)405.56 | (+)202.91 | (+)338.20 | 5.34 | 18.25 |
| 9 | Accumulated Losses | (-)2692.00 | (-)2462.46 | (-)2087.29 | (-)1681.73 | (-)1478.82 | (-)1263.44 | (-)1258.10 | (-)1239.85 |
| 10 | CRAR | 5.78 | 7.89 | 9.04 | 9.71% | 9.61% | 10.26% | 10.52 | 10.50 |
(Rs. in Crores)
| Year | Share Capital | Deposits | Borrowings | Lending | Interest income earned |
| 2008-09 | 32.74 | 132.17 | 107.74 | 200.22 | 37.67 |
| 2009-10 | 35.46 | 123.03 | 125.69 | 183.64 | 24.42 |
| 2010-11 | 37.80 | 134.81 | 142.28 | 218.19 | 22.06 |
| 2011-12 | 41.54 | 148.97 | 188.00 | 278.16 | 05.03 |
| 2012-13 | 45.15 | 171.09 | 223.56 | 328.09 | 30.39 |
| 2013-14 | 52.92 | 221.05 | 298.87 | 445.22 | 34.47 |
| 2014-15 | 56.62 | 265.39 | 320.63 | 445.47 | 59.93 |
| 2015-16 | 75.50 | 369.20 | 455.11 | 672.76 | 77.79 |
| 2016-17 | 91.44 | 477.07 | 611.01 | 862.19 | 103.94 |
| 2017-18 | 113.82 | 500.30 | 755.23 | 1044.06 | 103.62 |
| 2018-19 | 129.35 | 533.42 | 878.76 | 1182.80 | 109.34 |
| 2019-20 | 141.83 | 604.93 | 928.83 | 1286.14 | 129.69 |
(Rs. in lakhs)
| Particulars | Previous year 2017 | Present year 2018 | Increase percentage |
| Share capital | 9144.22 | 11382.15 | 24.47% |
| Reserves | 2498.17 | 2635.47 | 5.49% |
| Deposits | 47706.63 | 50030.50 | 4.87% |
| Loans &Advances | 95503.49 | 117026.81 | 22.53% |
| Loans O/s | 86219.89 | 104406.08 | 21.09% |
| Total NPA | 4279.42 | 5197.53 | |
| NPA % on Loans &Advances | 4.96% | 4.98% | |
| Recoveries % | 56.59 | 85.19 | -1.61% |
| Present year profit/loss | 434.23 | 338.20 | -22.11% |
| Total loss | 1478.82 | 1263.44 |
